LearnOpen Feedlio
Esc
↑↓ to move↵ to openSearches every guide and step
Home›Insights & Account›Analytics & reports
Guide 20 · Insights & Account

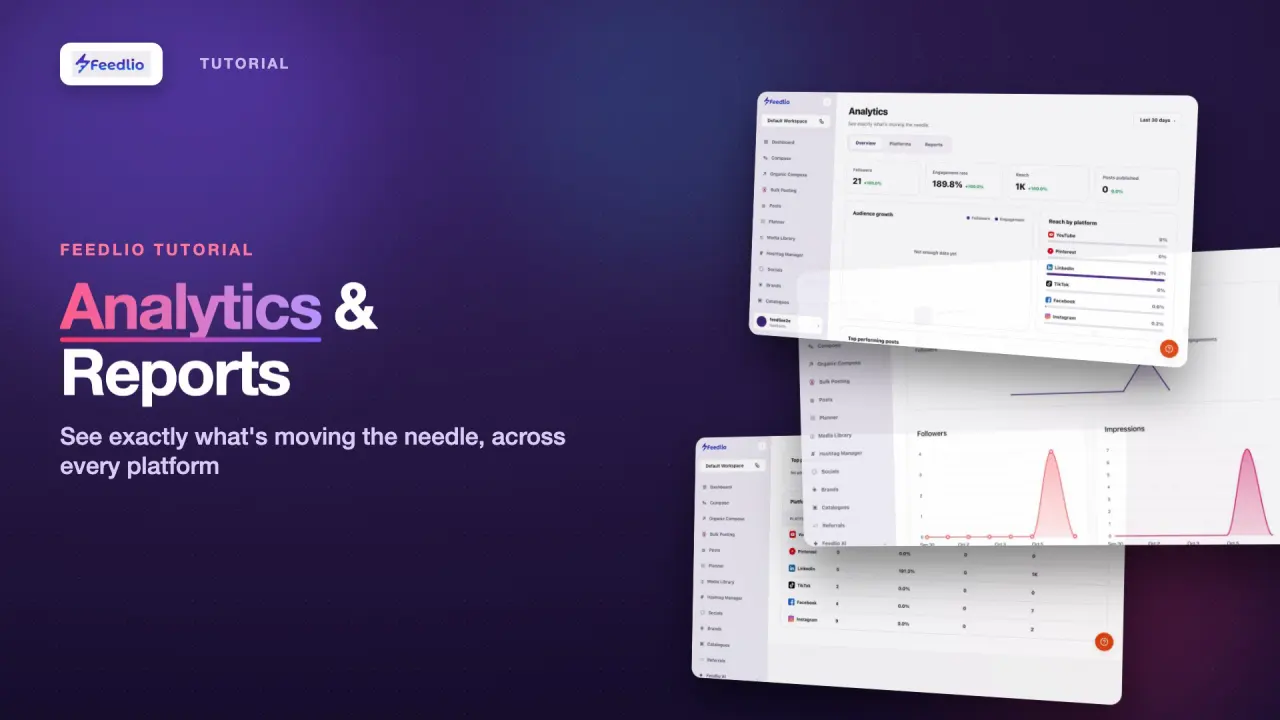
Analytics & Reports

Track how your followers, engagement and reach change over time, compare your networks side by side, and drill into any connected account. You can also schedule weekly or monthly performance reports.

1:34 video3 min read7 stepsAll plans
Analytics & Reports tutorial videoVideo coming soon

What you'll learn

  • Read your key numbers for any date range
  • See which networks bring you the most reach
  • Drill into one account's charts and post performance
  • Schedule weekly or monthly performance reports

Step by step

Follow along in the app. Tick each step off as you go.

STEP 1 of 7

Your key numbers

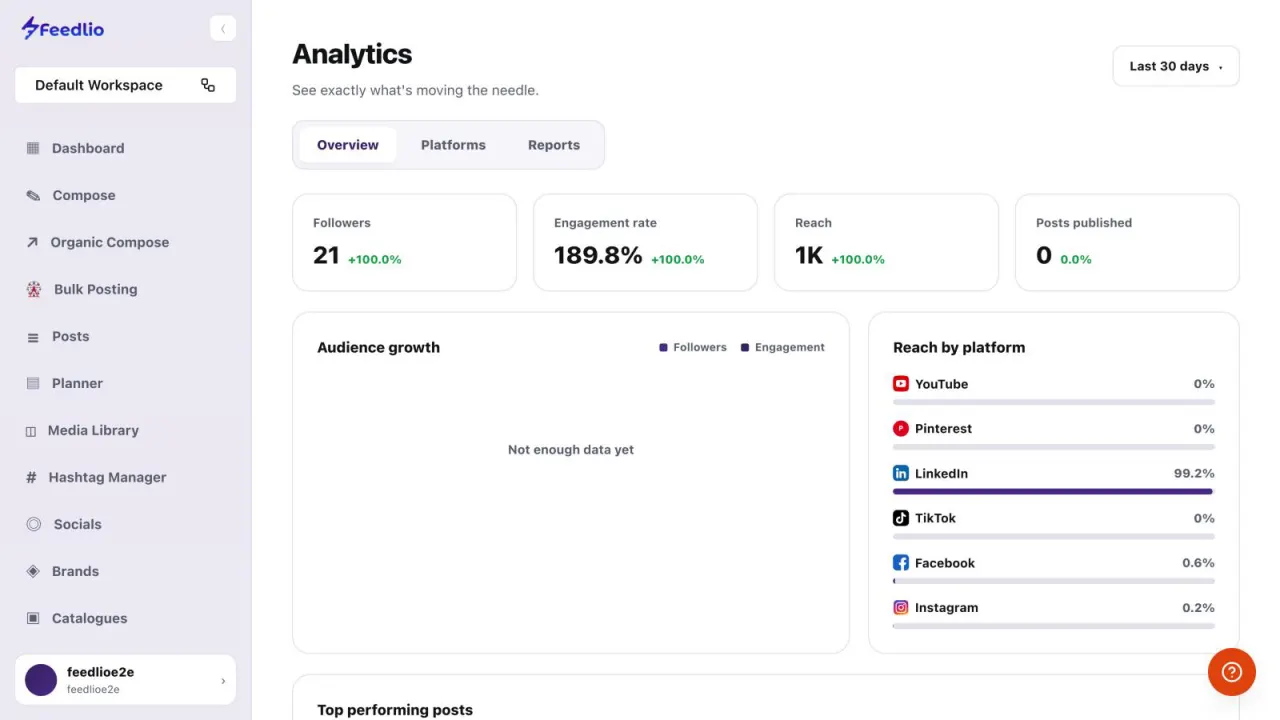
Click Analytics in the left sidebar. The Overview tab opens with four cards: Followers, Engagement rate, Reach and Posts published. The small figure next to each number is the change versus the previous period.

  • Followers & engagement rate
  • Reach & posts published
  • Change vs the previous period
feedlio.io/analyticsClick to zoom
Screenshot: Your key numbers
feedlio.io/analyticsClick to close
Screenshot: Your key numbers
Step 1: Your key numbersEsc to close
STEP 2 of 7

Pick a date range

Use the date range menu at the top right, such as Last 30 days, to change the period every card and chart covers. The tabs below the title switch between Overview, Platforms and Reports.

feedlio.io/analyticsClick to zoom
Screenshot: Pick a date range12
feedlio.io/analyticsClick to close
Screenshot: Pick a date range12
Step 2: Pick a date rangeEsc to close
STEP 3 of 7

Growth & reach

The Audience growth chart tracks followers and engagement over time. Reach by platform shows what share of your reach each network brings in.

feedlio.io/analyticsClick to zoom
Screenshot: Growth & reach12
feedlio.io/analyticsClick to close
Screenshot: Growth & reach12
Step 3: Growth & reachEsc to close
STEP 4 of 7

Compare platforms

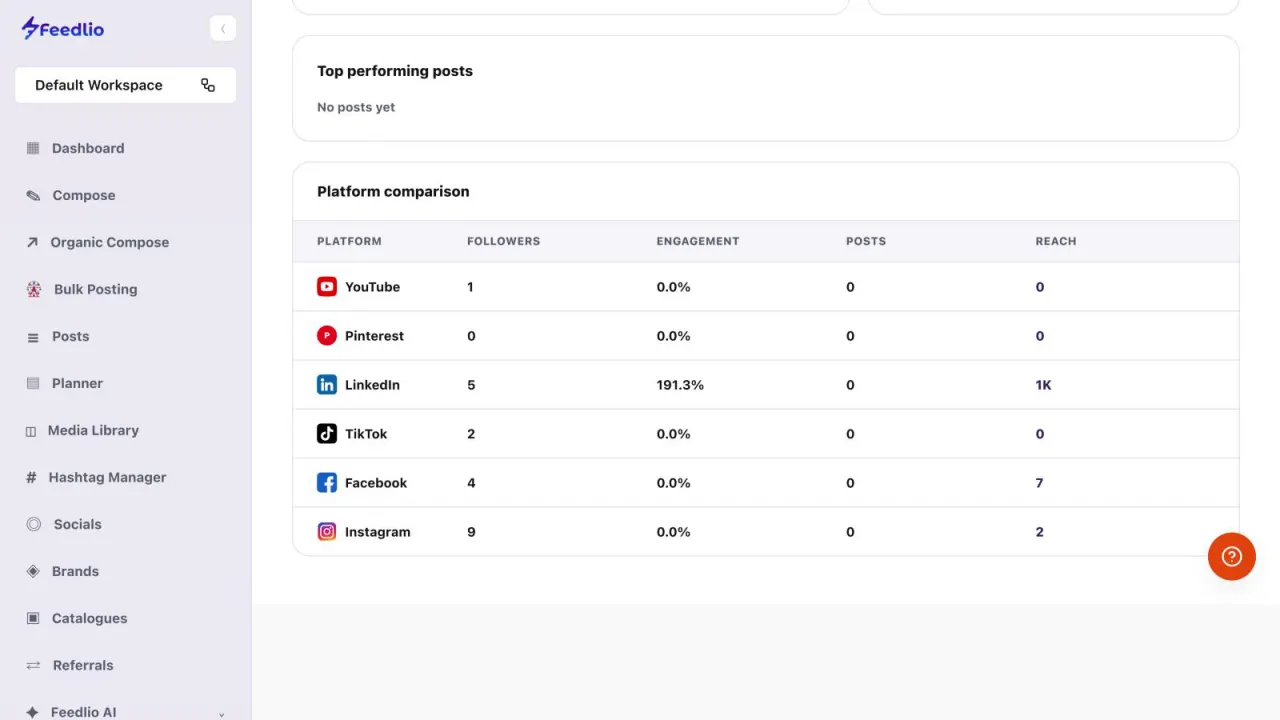
Scroll down to Top performing posts and the Platform comparison table. The table lists followers, engagement, posts and reach for every connected network, side by side.

feedlio.io/analyticsClick to zoom
Screenshot: Compare platforms
feedlio.io/analyticsClick to close
Screenshot: Compare platforms
Step 4: Compare platformsEsc to close
STEP 5 of 7

Drill into a platform

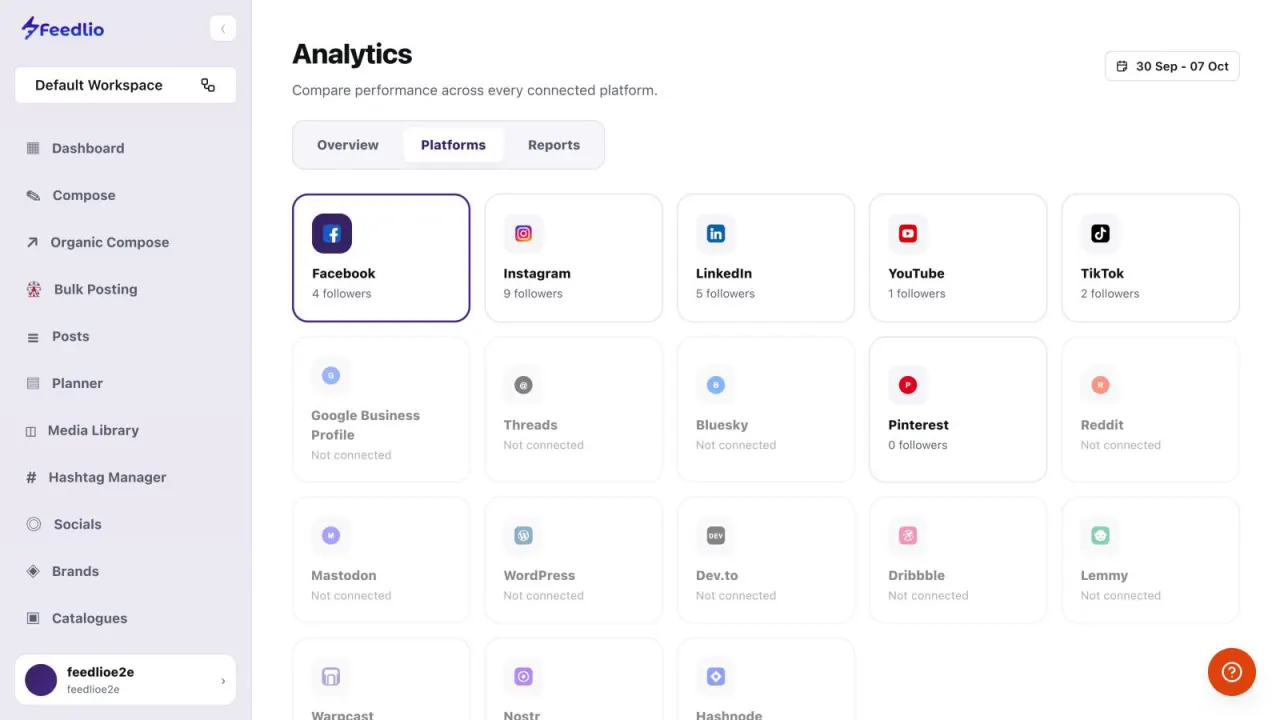
Open the Platforms tab and click any connected network to see its details. Networks you haven't connected yet are greyed out and marked Not connected.

Missing a network?

Only connected accounts have data. Connect it in Socials and it appears here.

feedlio.io/analyticsClick to zoom
Screenshot: Drill into a platform
feedlio.io/analyticsClick to close
Screenshot: Drill into a platform
Step 5: Drill into a platformEsc to close
STEP 6 of 7

Account metrics

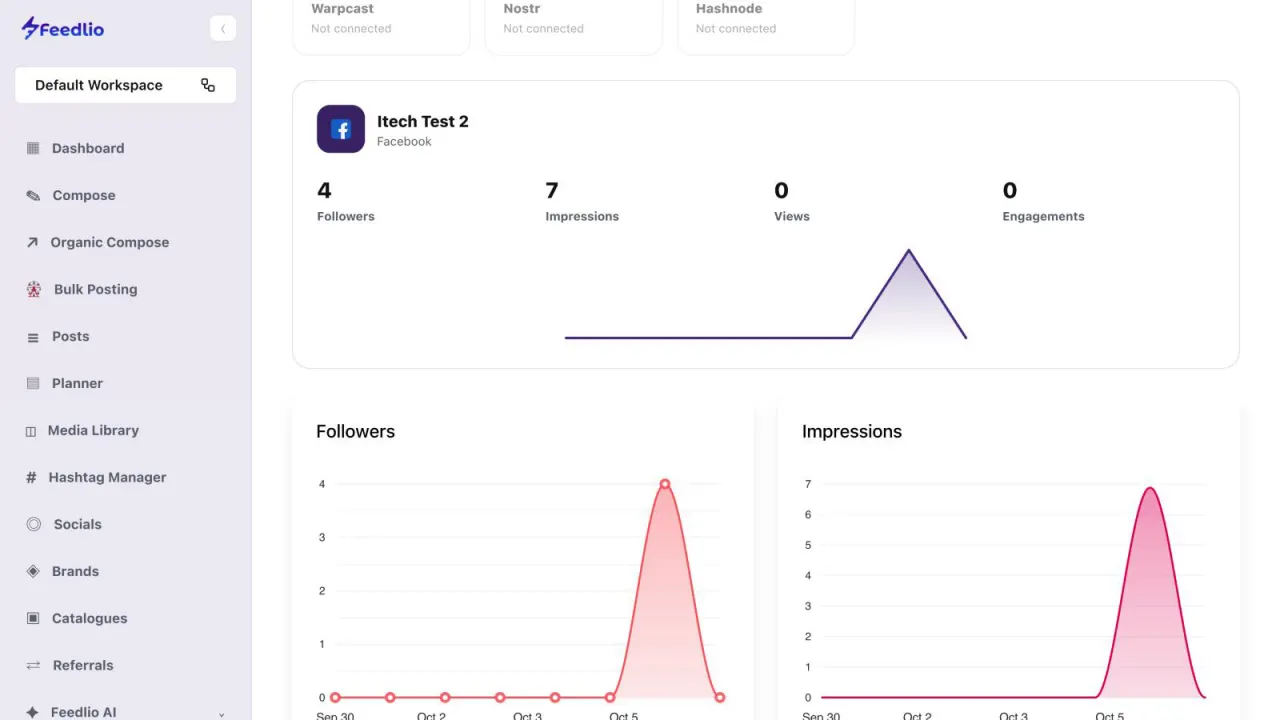
The account panel shows Followers, Impressions, Views and Engagements, with a daily chart for each. Below the charts, a table lists how each post performed. Click Sync Post Metrics to refresh those numbers.

  • Followers, impressions, views, engagements
  • Daily charts
  • Per-post table
feedlio.io/analyticsClick to zoom
Screenshot: Account metrics12
feedlio.io/analyticsClick to close
Screenshot: Account metrics12
Step 6: Account metricsEsc to close
STEP 7 of 7

Automatic reports

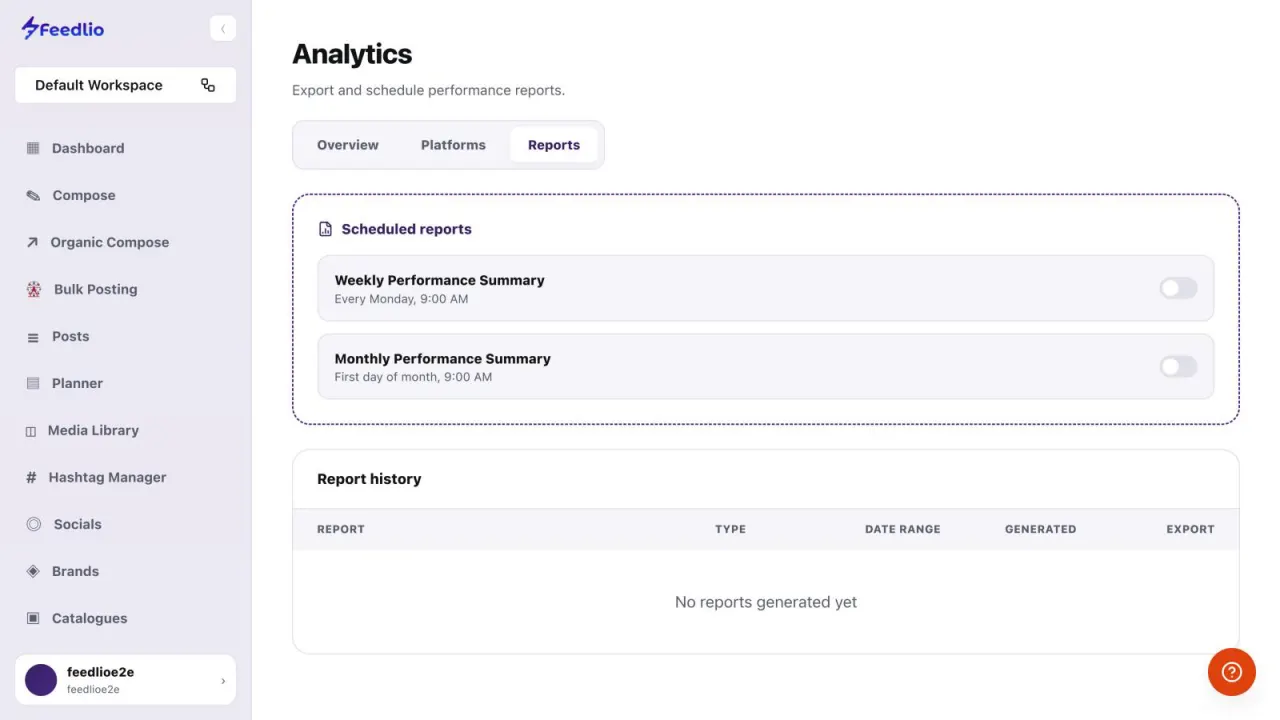
Open the Reports tab. Under Scheduled reports, switch on the Weekly Performance Summary, the Monthly Performance Summary, or both. Generated reports appear in Report history, where you can export them.

  • Weekly: every Monday, 9 AM
  • Monthly: first day, 9 AM
  • Export from report history
feedlio.io/analyticsClick to zoom
Screenshot: Automatic reports12
feedlio.io/analyticsClick to close
Screenshot: Automatic reports12
Step 7: Automatic reportsEsc to close
Recap

Insights unlocked

Track followers, engagement and reach on Overview, compare platforms, drill into each account's charts and posts, and schedule weekly or monthly reports.

Next: Profile & settings

Questions people ask

Which networks show up under Platforms?

Every network Feedlio supports is listed. Connected ones show their follower count and can be opened. The rest are greyed out and marked Not connected until you connect them in Socials.

Why does Top performing posts say No posts yet?

This list is built from posts you have published through Feedlio. Once your posts go live, they appear here.

How do I refresh the numbers for my posts?

Open the Platforms tab, pick an account, and click Sync Post Metrics above its post table.

When are scheduled reports sent?

The Weekly Performance Summary runs every Monday at 9:00 AM. The Monthly Performance Summary runs on the first day of each month at 9:00 AM.

Where can I download a report?

Open Analytics, then Reports. Generated reports are listed under Report history, with an Export option for each one.

Video transcript

Read the full narration

0:00Feedlio Analytics shows how your audience and engagement are growing, which platforms drive your reach, and lets you schedule automatic performance reports.

0:10Open Analytics from the sidebar. The Overview shows your followers, engagement rate, reach and posts published, each with its change versus the previous period.

0:21Change the date range at the top right, and switch between the Overview, Platforms and Reports tabs.

0:28The audience growth chart tracks followers and engagement over time, and Reach by platform shows which networks bring the most eyeballs.

0:37Further down, see your top performing posts and a platform comparison table with followers, engagement, posts and reach for every network.

0:46In the Platforms tab, click any connected network to explore it in detail.

0:52Each account shows its followers, impressions, views and engagements, with daily charts. Below, a post table lists every post's performance, and Sync Post Metrics refreshes the numbers.

1:05In Reports, switch on a weekly or monthly performance summary to receive it automatically. Generated reports appear in the history, ready to export.

1:15Recap: track followers, engagement and reach on Overview, compare platforms, drill into each account's charts and posts, and schedule weekly or monthly reports.

1:27Now you can grow with real data. Next, let's set up your profile, workspace and notifications in Settings.

Related guides